Selecting information for IELTS Writing Task 1 – reasons for using the internet
Knowing how to select information in writing Task 1 is a key skill.
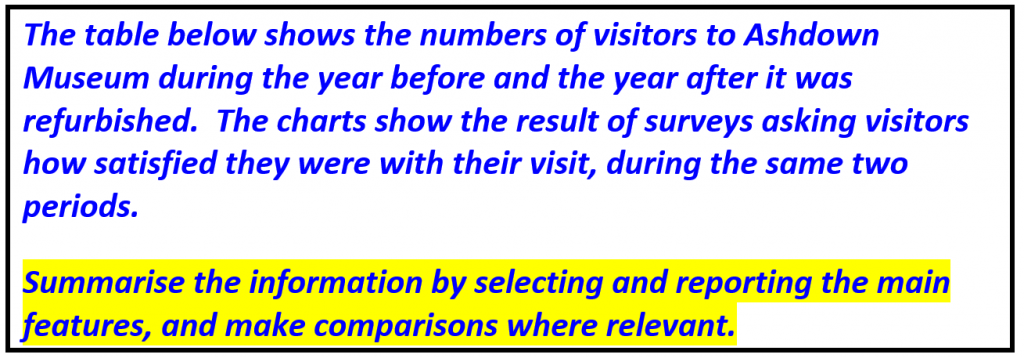
In every question you will ever see in writing Task 1, the instructions state:
This is the key phrase:
Summarise the information by selecting and reporting the main features, and make comparisons where relevant.
The words summarise and select mean that it is not always necessary to give every detail provided in the question. Of course, sometimes you do need to give all the figures.
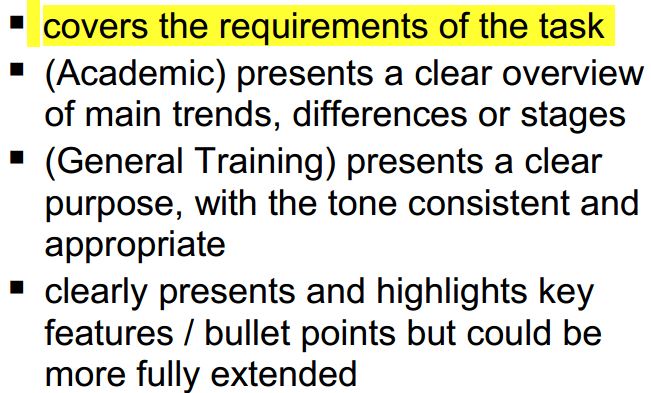
The examiners' criteria state that a band score 7 is awarded to a candidate who
Band score 7 TA
In other words, in order to get a 7 for Task Achievement, you need to know how to select information.
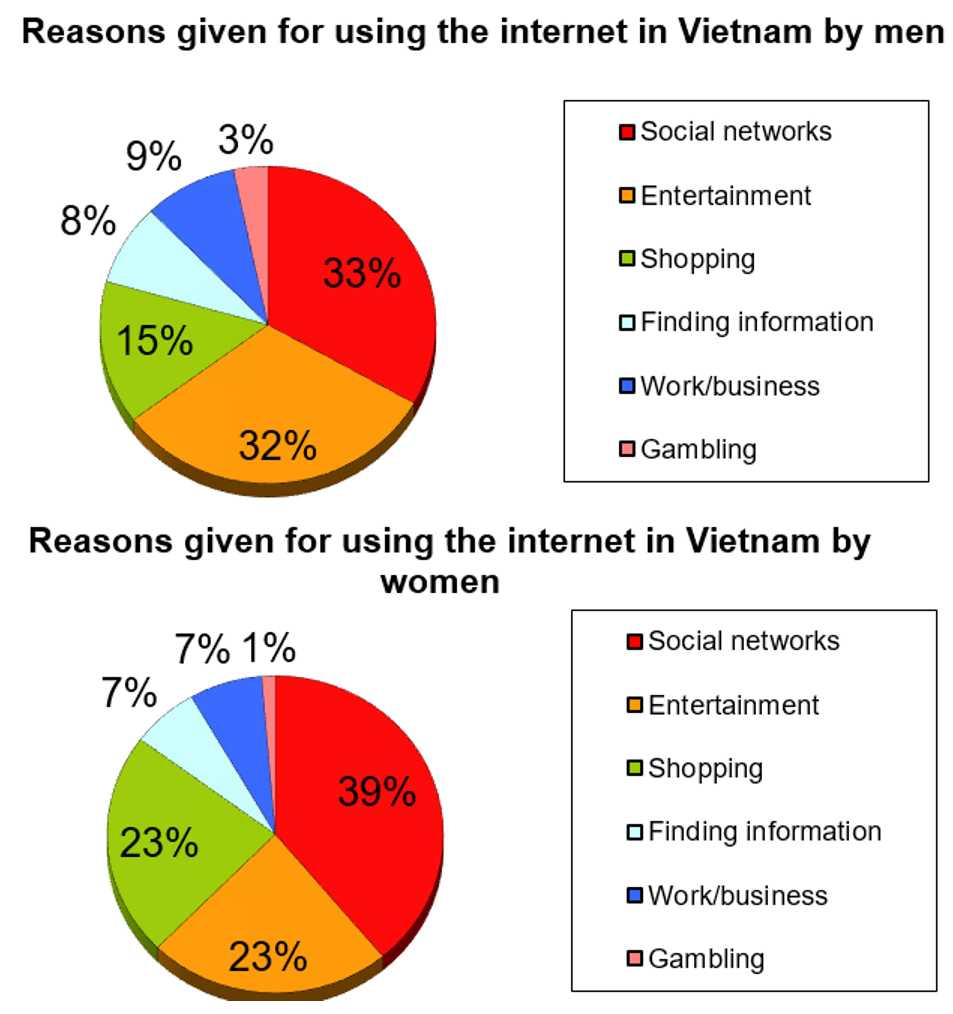
Look at these pie charts and decide what information you should select. Then click on the + sign below to see an illustration of information selection.
In a bar or line chart there is often, but not always, a lot of information and it is important to remember the instructions.
Summarise the information by selecting and reporting the main features, and make comparisons where relevant.
In a table or pie chart, there is often, but not always, less information.
The key words are summarise and the main features.
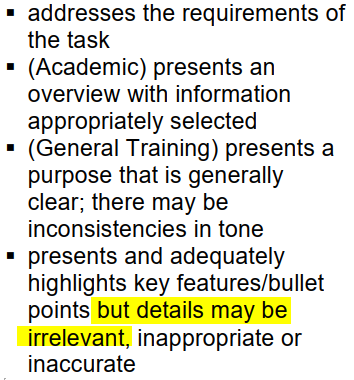
If there is too much information to describe, do not attempt to give all the information because to do so would take to long, and it is not necessary. You may be penalised if you attempt to describe everything. Remember, you are asked to summarise the information.
Band score 6 TA
For more information on Task 1 questions see here
See Task 1 Sample Marked Scripts (AC) here
See Task 1 Model Answers here
Posts about selecting information
Task 1 models and marked scripts
Let me know what you think - leave a comment below.
Click on the icons below to share.
Contact me here.







The pie charts give information about the reasons for using the Internet by Vietnamese men and women. Overall, there is a similarity between two sexes in the reason of using the internet, in which, the more common reasons are for social networks, entertainment and shopping, while the less are for finding information, work or business and gambling. With regard to the more common reasons, it can be seen that, women are more likely to use the internet for social networks than men, with the respective figures of 40% and 35%. Similarly, 19% of women use the Internet for shopping while… Read more »
Hi Anh Thu
Good answer – I love your signposting. Where did you learn that?
Can you fix this:
the figures for men and women surfing the internet for finding information
Hi Tony,
Thank you very much Tony. I am one of your students in RES 🙂 and I’ve learnt about signposting from your lesson.
The figures for men and women who surf the internet in order to find information and to work or to do business are just around 7% or 8%.
Hi Anh Thu
Thanks of course I knew you were my student 🙂
Well done with the correction
Tony
I personally will choose the biggest and smallest or most noticeable one in the information the test have given, therefore making comparison much more easier and clear since when giving these 2 charts it’s obvious they want you to compare and give a conclusion where possible
Hi Mai
Selecting the largest and the smallest would be suitable for the overview.
In the main body it’s better to mention all the figures if there are only 12
No conclusion necessary.